Table of Contents
- Why Graphs Are Essential in Notion
- Why Use Graphs to Visualize Your Data?
- Enhanced Data Comprehension
- Improved Communication
- Increased Engagement
- Streamlined Workflows
- Facilitating Analysis
- Personal Productivity Tracking
- Data-Driven Decision Making
- Related Reading
- Setting Up Your First Graph in Notion
- Pick Your Data Source Like a Pro
- Create a Graph View
- Choose a Graph Type
- Customize Your Graph Settings
- Add Filters and Sorting
- Finalize and Share Your Graph
- Create a Form for Free Today with our Notion Forms Builder
- 7 Ways to Make Graphs in Notion
- 1. Use NoteForms to Collect and Visualize Data in Notion
- 2. Use Google Sheets Integration for Graph Creation
- Why This Works
- 3. Use Simple CSV Imports for Graphs
- Why This Works
- 4. Leverage Airtable Integrations for Advanced Graphs
- Why This Works
- 5. Create Charts Using Third-Party Tools Like ChartBlocks
- Why This Works
- 6. Use Notion Widgets for Real-Time Graph Updates
- Why This Works
- 7. Create Graphs Using Power BI Integrations
- Why This Works
- Related Reading
- Practical Use Cases for Notion Graphs
- Unlocking User Engagement Stats with Notion Graphs for SaaS Startups
- Engage Students and Visualize Their Performance with Notion Graphs for Schools
- Visualizing Task Completion Rates With Notion Graphs for Project Management
- Notion Graphs for Sales Teams: Visualizing Revenue Growth
- Use Notion Graphs to Visualize Marketing Campaign Performance
- Notion Graphs Help HR Departments Analyze Employee Satisfaction
- Individuals Can Use Notion Graphs to Improve Their Productivity
- Create a Form for Free Today with our Notion Forms Builder
- Practical Tips and Best Practices for Effective Graph Usage
- Boost the Readability and Clarity of Your Notion Graphs
- Use Legible Fonts and Colors
- Clear Labels and Titles
- Incorporate White Space
- Avoid Clutter
- Collaborate with Your Team in Notion to Improve Your Graphs
- Gather Feedback from Peers
- Real-Time Editing
- Commenting for Context
- Version Control
- Customize Your Notion Graphs for Your Needs
- Tailor Graph Appearance
- Adjust Chart Dimensions
- Data Labels and Gridlines
- Interactive Elements
- Use Notion Graphs to Track Progress and Analyze Trends
- Use Graphs for Regular Updates
- Analyze Trends Over Time
- Set Benchmarks for Comparison
- Highlight Key Insights
- How NoteForms Enhances Data Visualization in Notion
- Smooth Integration with Notion Databases
- Field Type Compatibility
- People and Relation Fields
- Customizable Forms for Enhanced User Experience
- Styling Options
- Conditional Logic
- Ready-Made Templates
- Efficient Data Collection and Storage
- Automatic Data Entry
- Notifications
- File Uploads
- Enhanced Data Visualization Capabilities
- Creating Graphs from Collected Data
- Trend Analysis
- Data Filtering and Sorting
- Practical Applications Across Industries
- Customer Feedback Collection
- Employee Surveys
- Project Updates
- Event Registrations
- Academic Research
- Create a Form for Free Today with our Notion Forms Builder
- Common Pitfalls When Using Notion for Graphs and How to Overcome Them
- Data Formatting Disasters: What They Are and How to Avoid Them
- Solution
- Pre-check Data Formatting Before Import
- Clean Up Data Using Google Sheets or Excel
- Leverage CSV Formatting Tools
- Notion Graphs and Real-Time Data: No Match Made in Heaven
- Solution
- Use Third-Party Integration Tools
- Manual Refresh for Time-Sensitive Data
- Embed Live Google Sheets or Airtable Views
- The Limited Native Graphing Options in Notion
- Solution
- Use Integrations for More Complex Graphs
- Embed External Graphing Tools
- Export Data to External Tools
- Performance Issues with Large Notion Databases
- Solution
- Segment Large Databases
- Archive Old Data
- Use Filters for Graphing
- Data Privacy and Security Risks with Notion Graphs
- Solution
- Ensure Encryption and Data Privacy Policies Are Followed
- Use Permission-Based Sharing
- Anonymize Sensitive Data
- Create a Form for Free Today with our Notion Forms Builder
- Related Reading

Do not index
Created time
Sep 26, 2024 08:02 AM
Notion for Business offers many benefits, including the program's user-friendly interface, which makes it easy to set up and customize a workspace to meet your unique needs. However, adding more information to your Notion database can become overwhelming and challenging.
Graphs and charts visually represent your data to help you identify patterns, find insights, and make informed decisions. Notion graphs allow you to create these visuals within your Notion workspace. This guide will help you get started with notion graphs. You'll learn ten easy ways to use notion graphs for your business, plus seven ways to make your graphs and charts in Notion.
One way to make using Notion graphs easier is with Notion forms. This tool will help you achieve your goals with graphs in Notion by allowing you to collect and organize your data before creating your visualizations.
Why Graphs Are Essential in Notion

Notion is a powerful and versatile productivity tool that has gained significant traction among users looking to streamline their workflows and enhance collaboration. As an all-in-one workspace, Notion combines various functionalities such as note-taking, task management, project planning, and knowledge management into a single platform.
This integration eliminates the need for multiple applications, reducing the complexity of managing different tools and enhancing overall efficiency. Notion's customizable interface enables users to tailor their workspace according to their specific needs, making it suitable for various applications, from personal productivity to team collaboration in professional settings.
Why Use Graphs to Visualize Your Data?
Graphs are crucial in data visualization, particularly in environments like SaaS startups, educational institutions, and personal productivity contexts. Here’s why they are essential:
Enhanced Data Comprehension
In fast-paced industries like SaaS, where data-driven decisions are vital, graphs help distill complex information into easily digestible visual formats. This allows teams to quickly grasp trends, patterns, and insights that might be obscured in raw data.
Improved Communication
Visual representations of data facilitate more transparent communication among team members and stakeholders. Instead of sifting through spreadsheets or lengthy reports, stakeholders can interpret data at a glance through graphs, leading to more effective discussions and decision-making.
Increased Engagement
For educators, using graphs in presentations or reports can significantly enhance student engagement. Visual aids capture attention more effectively than text-heavy documents, making it easier for students to understand and retain information.
Streamlined Workflows
By integrating graphs into their Notion workspaces, users can create dashboards that provide real-time insights into key performance indicators (KPIs) and project statuses. This visibility helps teams stay aligned on goals and priorities without the need for constant updates or meetings.
Facilitating Analysis
Graphs enable users to conduct comparative analyses efficiently. For example, SaaS startups can visualize user engagement metrics over time to identify which features are most popular or which marketing strategies yield the best results.
Personal Productivity Tracking
On a personal level, individuals can use graphs to track their productivity metrics—such as task completion rates or time spent on various activities—allowing them to make informed adjustments to their routines for better time management.
Data-Driven Decision Making
Ultimately, the ability to visualize data through graphs empowers users across sectors to make informed decisions based on empirical evidence rather than intuition alone. This is particularly important in competitive environments where strategic decisions can significantly impact success.
Related Reading
Setting Up Your First Graph in Notion
Pick Your Data Source Like a Pro
To create your first graph in Notion, you need to pick your data source. This is the database or data set that you will visualize. You can select an existing database or build a new one from scratch. The more organized your data is, the smoother the graph creation process will be.
Create a Graph View
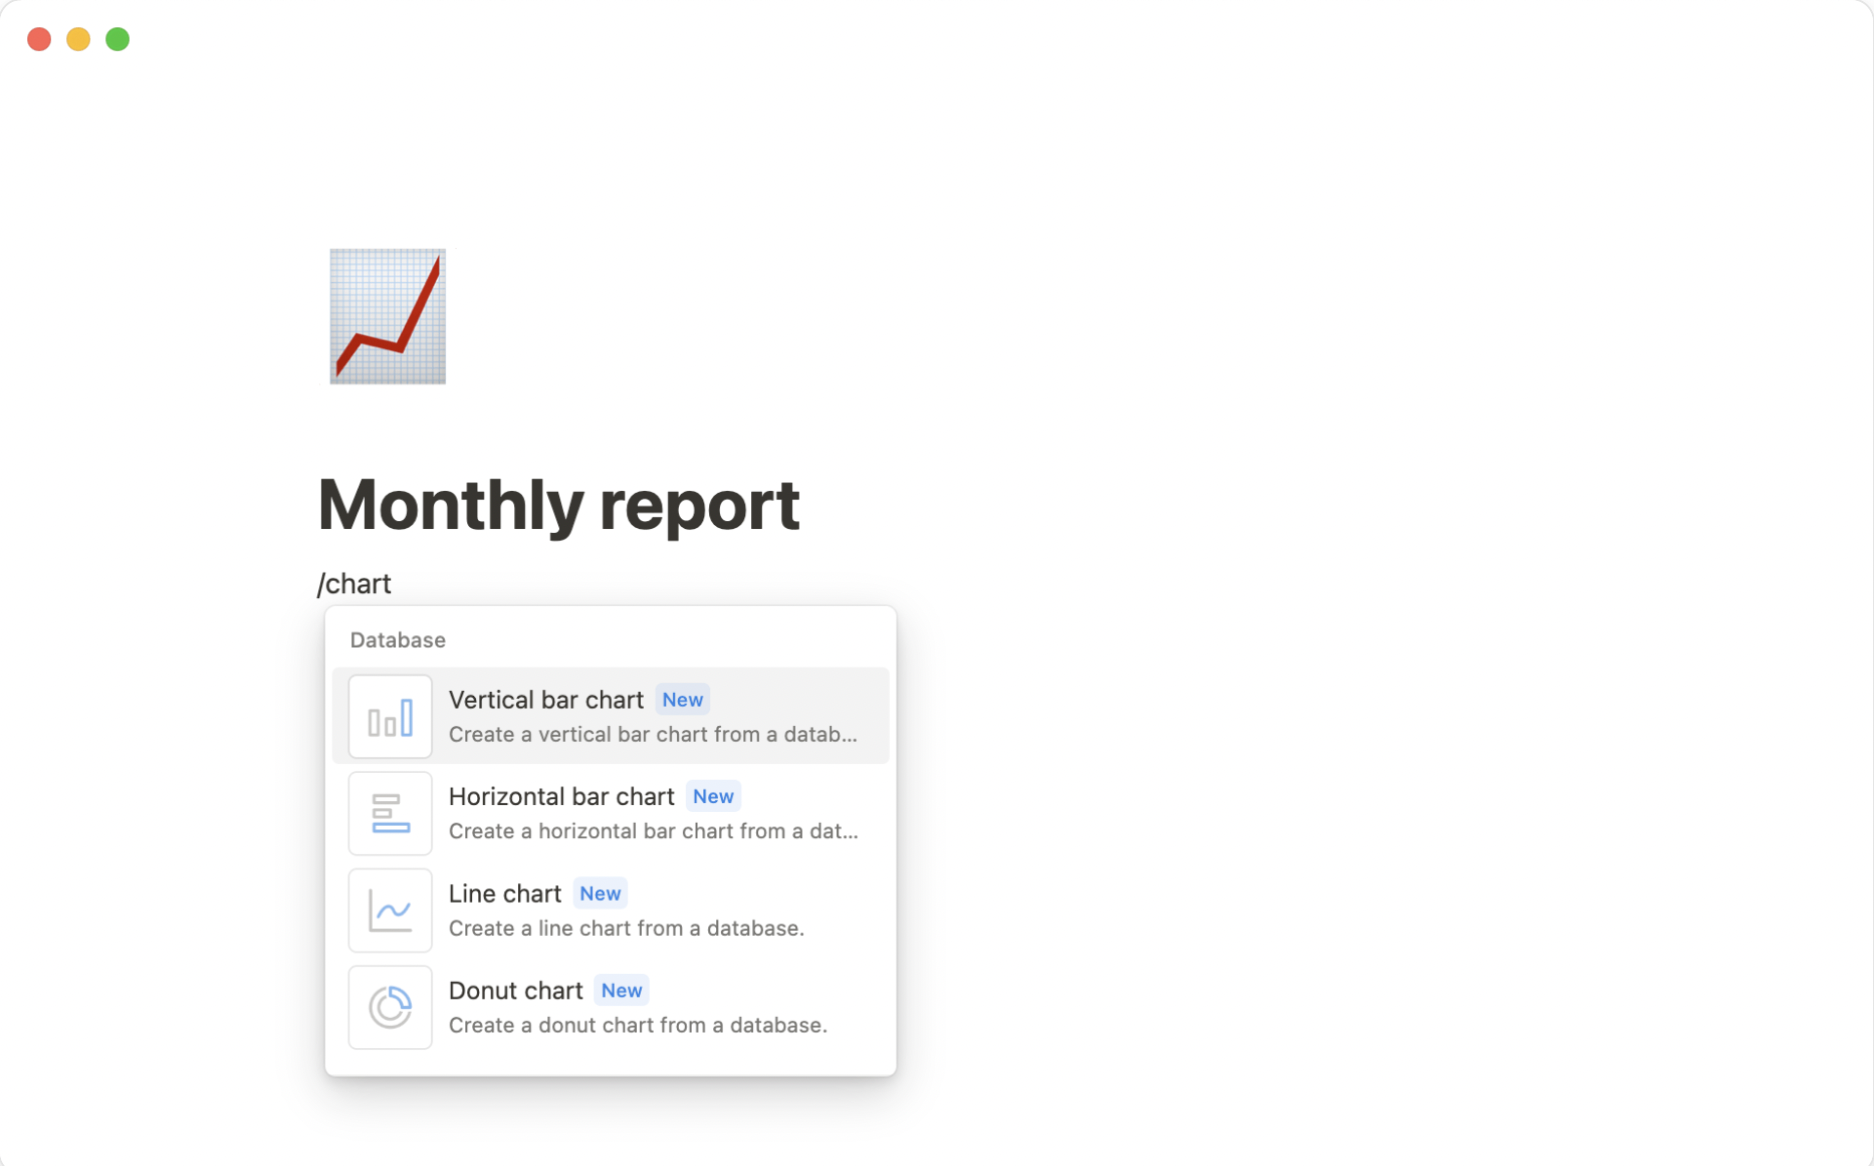
Next, open up the database you want to graph and locate the “Views” button in the upper right corner of the screen. Click on this button, and a dropdown menu will appear. From here, select “New View.” In the window that pops up, pick “Graph” to generate a blank graph based on your database.
Choose a Graph Type
No, it’s time to choose a graph type. Notion offers several options, including pie charts, bar graphs, line graphs, and scatter plots. The best graph type for your data will depend on the information you want to convey. For instance, bar graphs are great for comparing different categories, while line graphs excel at showing trends over time.
Customize Your Graph Settings
Notion allows you to customize various aspects of your graph to make it visually appealing and informative. You can adjust the colors, labels, axis titles, fonts, and more to suit your preferences. Take some time to experiment with different settings and find the combination that works best for your data and intended audience.
Add Filters and Sorting
To refine your graph and focus on specific data points, utilize Notion's filtering and sorting capabilities. You can filter your data based on various criteria, such as status, due date, or category. Sorting options allow you to arrange your data in ascending or descending order, making it easier to identify patterns and trends.
Finalize and Share Your Graph
Once you're satisfied with your graph, give it a descriptive title and add any necessary context or explanations. You can then share your graph with others by copying the link or embedding it directly into a Notion page. Notion's collaboration features enable real-time editing and feedback, allowing you to refine your graph based on input from team members or stakeholders.
Create a Form for Free Today with our Notion Forms Builder
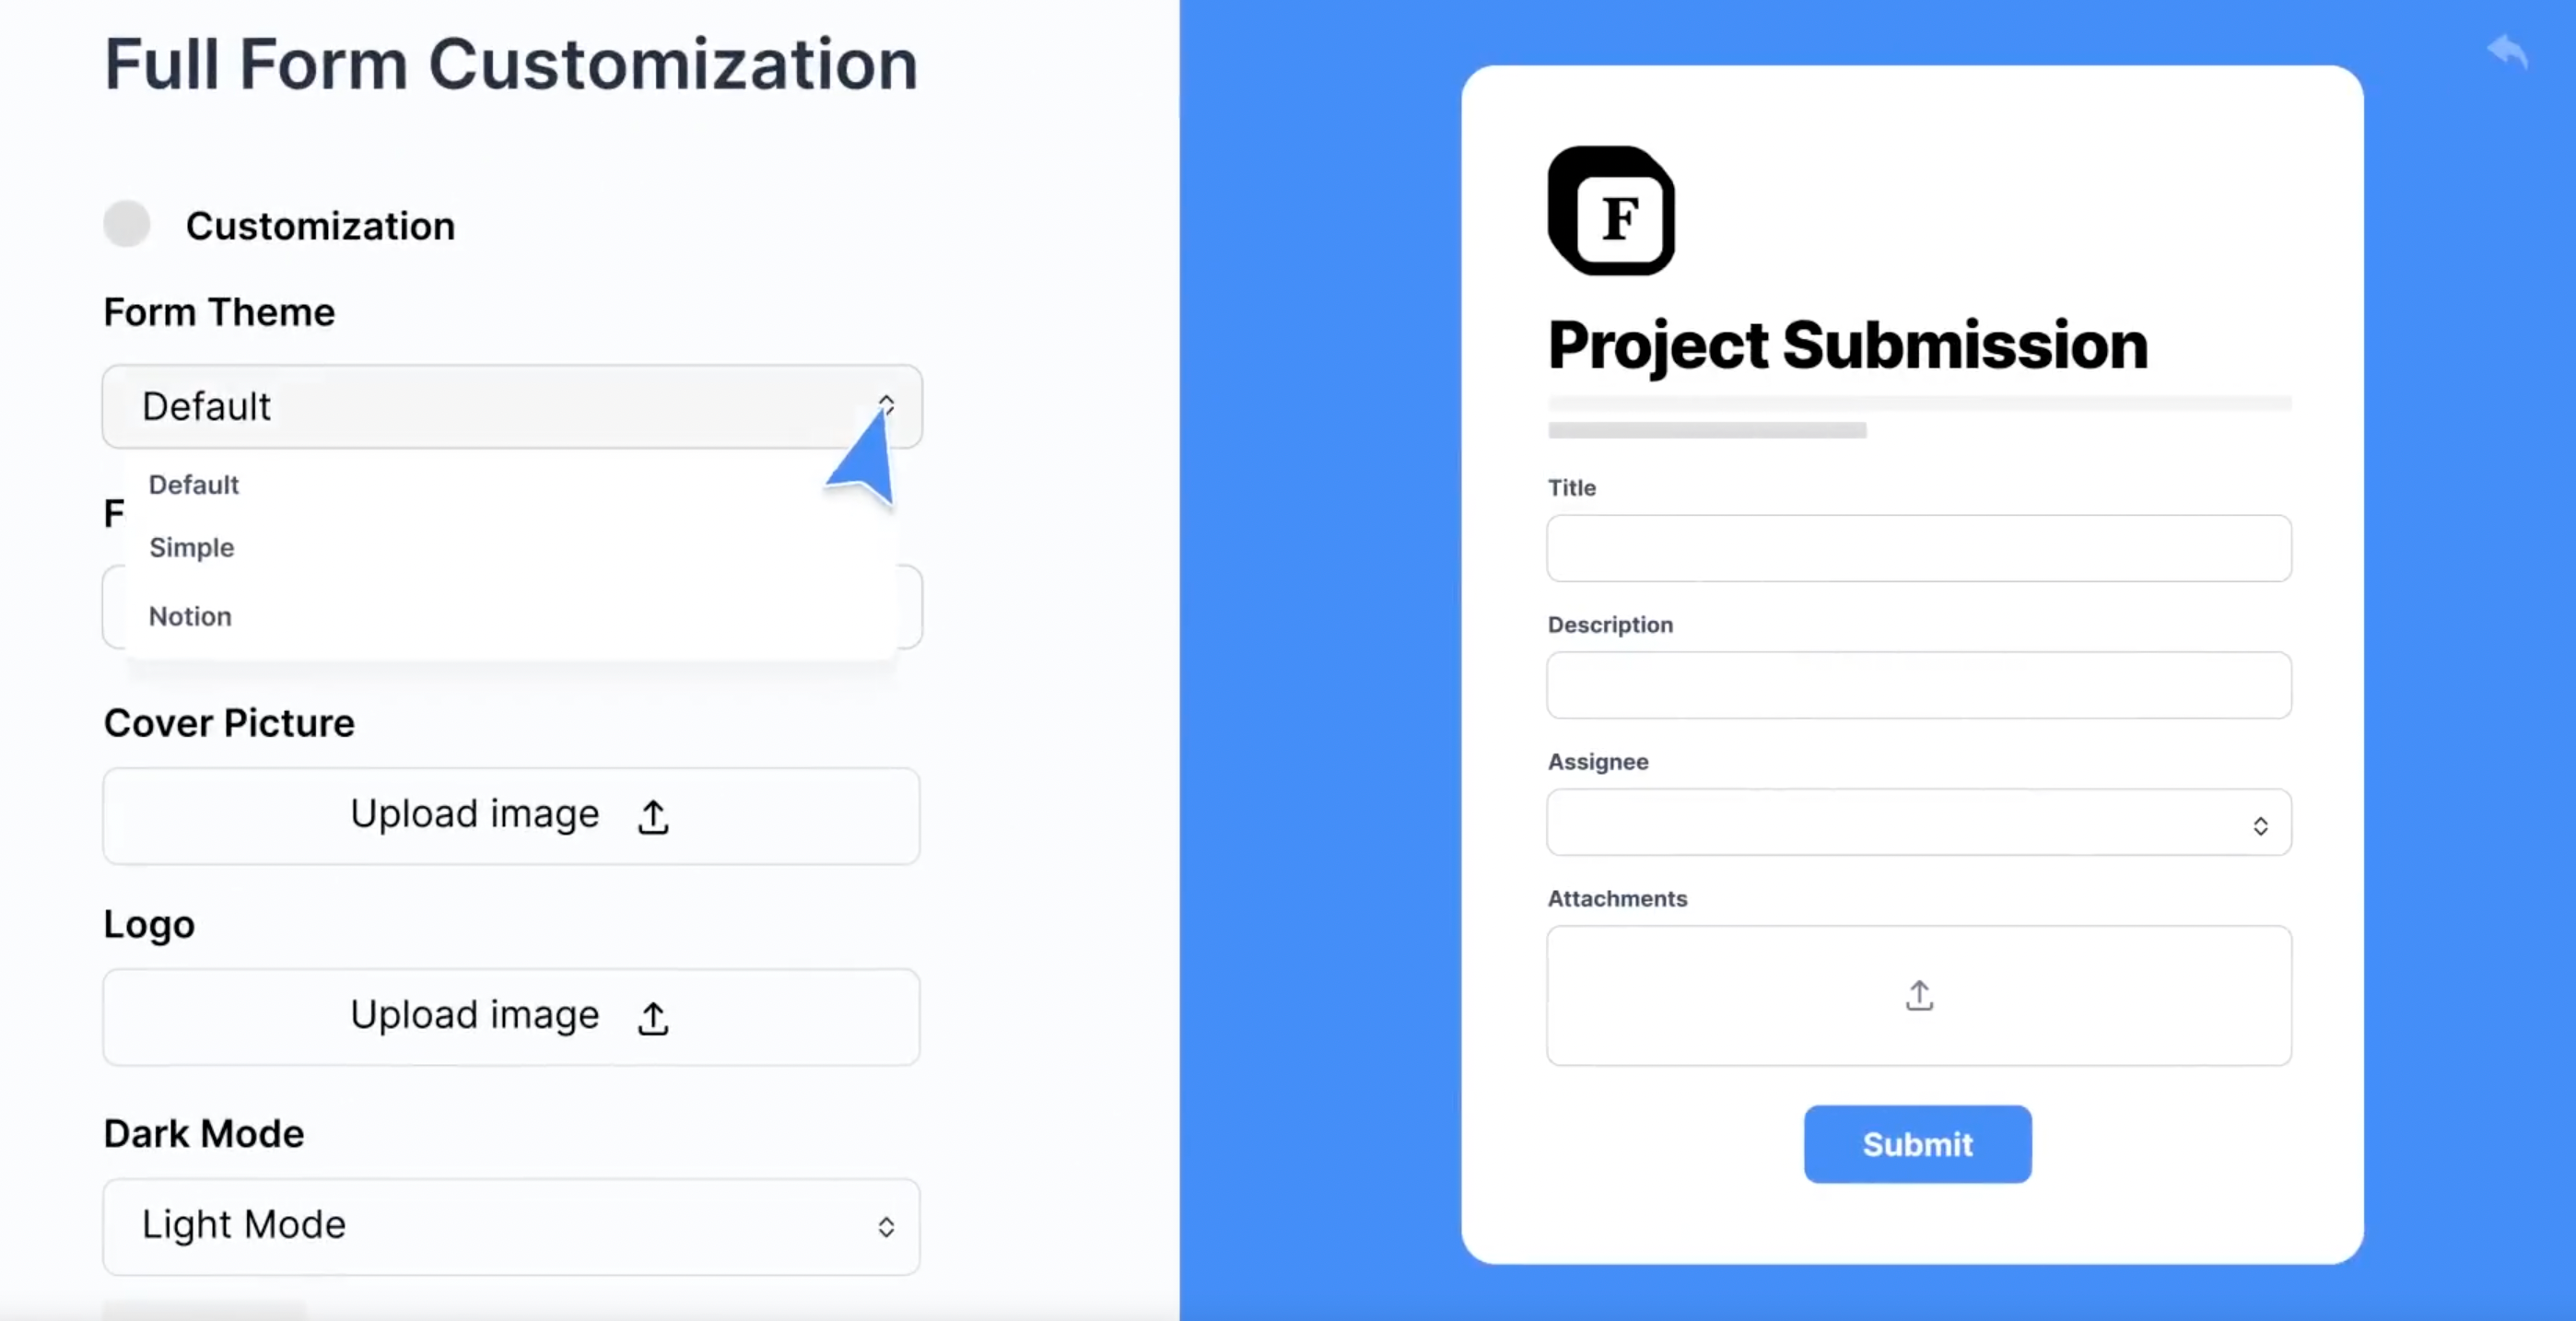
NoteForms's Notion forms builder supercharges Notion by enabling seamless form creation that integrates directly with Notion databases. Our key features include creating forms from existing Notion DBs, storing submissions in Notion DBs, unlimited forms and submissions, full customization (custom domains, design, logic, webhooks), embeddable forms, integrations (email, Zapier, Slack), support for Notion-specific columns (relation, people), writing to page body, and database views as a sub-product.
We cater to Notion power users, SaaS startups, and educators, solving challenges like inefficient data entry, fragmented workflows, and administrative overload. NoteForms streamlines data collection, centralizes management, and simplifies workflows, boosting productivity while cutting costs for Notion enthusiasts. Create a form for free today with our Notion forms builder!
7 Ways to Make Graphs in Notion
1. Use NoteForms to Collect and Visualize Data in Notion
Custom forms can collect and visualize user data in Notion to help teams make informed decisions. NoteForms is a Notion template that allows you to create and customize forms that directly integrate with Notion databases.
When users fill out your form, their responses are automatically organized in your Notion database. This data can then be visualized using Notion graphs, providing instant insight into your data. It’s beneficial for teams looking to manage workflows and make informed decisions based on real-time input.
2. Use Google Sheets Integration for Graph Creation
Notion doesn’t yet have robust built-in graphing capabilities, but you can integrate it with Google Sheets to create automatically updated graphs based on live data. Once the data is in Google Sheets, you can visualize it using its built-in chart creation tools (bar graphs, pie charts, line graphs).
Why This Works
Google Sheets is widely used, and its graphing capabilities are robust. You can easily create and customize graphs based on your data. Once created, the graph can be embedded back into Notion using the “Embed” block, keeping your workspace organized and informative.
3. Use Simple CSV Imports for Graphs
Another method for creating graphs from your Notion data is to export your Notion databases to CSV format and import them into external tools like Excel or Google Sheets for graph creation. These platforms have extensive options for graph customization, including line charts, scatter plots, and histograms.
Why This Works
CSV exports allow you to move structured data from Notion into more powerful graphing tools. Excel, for example, offers various types of charts that are useful for analyzing complex data sets.
4. Leverage Airtable Integrations for Advanced Graphs
Airtable’s built-in charting features can be accessed by integrating Airtable with Notion to create a variety of graphs based on your database, including bar charts, pie charts, and line graphs. You can embed these graphs directly into Notion using the “Embed” block.
Why This Works
Airtable is known for its visual database management system. It is an excellent platform for creating highly customized and visually appealing graphs that update automatically with changes in the Airtable database.
5. Create Charts Using Third-Party Tools Like ChartBlocks
Use a tool like ChartBlocks to create detailed charts and graphs from your Notion data. Once created, you can embed these graphs into your Notion workspace for seamless integration.
Why This Works
ChartBlocks is a dedicated charting tool that offers various customization options for your graphs. It allows users to build detailed charts based on data uploaded from CSVs, making it ideal for businesses that need professional-quality visuals.
6. Use Notion Widgets for Real-Time Graph Updates
Install Notion widgets like NotionCharts or ChartWidget to embed live graphs into your Notion pages. These widgets sync data from external sources and update automatically to reflect real-time changes.
Why This Works
These widgets allow real-time data tracking, meaning you don’t need to update your graphs manually. This is ideal for teams or businesses that rely on up-to-the-minute data for decision-making.
7. Create Graphs Using Power BI Integrations
Connect Power BI to your Notion database to create rich, interactive graphs and dashboards. Power BI’s advanced data analytics capabilities make it one of the most powerful tools for visualizing data. Once the visualizations are created, they can be easily accessed into Notion.
Why This Works
Power BI offers more interactive and detailed graphing options than other tools, making it ideal for complex data sets. It also provides a range of customization options for users who need precise control over their visualizations.
Related Reading
Practical Use Cases for Notion Graphs

Unlocking User Engagement Stats with Notion Graphs for SaaS Startups
SaaS startups must often monitor user engagement metrics to refine their products and marketing strategies. By creating a line graph in Notion, teams can visualize user activity over time, such as daily active users (DAUs) or feature usage statistics. This visual representation helps identify trends, peak usage times, and areas where user engagement may decline, allowing teams to implement targeted improvements or marketing campaigns.
Engage Students and Visualize Their Performance with Notion Graphs for Schools
Educators can utilize Notion graphs to track student performance across various assessments. By inputting grades into a database and generating bar graphs, teachers can easily compare the performance of different classes or individual students over time. This data visualization aids in identifying students who may need additional support and allows educators to adjust their teaching strategies based on performance trends.
Visualizing Task Completion Rates With Notion Graphs for Project Management
Visualizing task completion rates in project management can provide insights into team productivity. Project managers can quickly assess progress toward project milestones by creating a pie chart in Notion that represents the percentage of completed tasks versus outstanding tasks. This visualization helps identify workflow bottlenecks and facilitates discussions during team meetings about reallocating resources or adjusting deadlines.
Notion Graphs for Sales Teams: Visualizing Revenue Growth
Sales teams can benefit from tracking revenue growth using Notion graphs. By compiling sales data into a database and generating a line graph that displays monthly revenue figures, sales managers can easily visualize growth patterns over time. This information is crucial for forecasting future sales, setting realistic targets, and identifying seasonal trends that may impact revenue.
Use Notion Graphs to Visualize Marketing Campaign Performance
Marketing teams can use Notion graphs to analyze the effectiveness of various campaigns. By collecting data on metrics such as click-through rates (CTR), conversion rates, and customer acquisition costs (CAC), marketers can create bar or line graphs to compare the performance of different campaigns side by side. This analysis helps determine which strategies yield the best results and informs future marketing efforts.
Notion Graphs Help HR Departments Analyze Employee Satisfaction
HR departments can leverage Notion graphs to visualize results from employee satisfaction
surveys. By inputting survey responses into a database and creating pie charts or bar graphs representing the distribution of satisfaction levels across different departments or demographics, HR professionals can identify areas for improvement within the organization. This data-driven approach fosters a culture of transparency and responsiveness to employee needs.
Individuals Can Use Notion Graphs to Improve Their Productivity
Individuals looking to optimize their productivity can use Notion graphs to track how they spend their time throughout the week. Users can identify patterns in their daily routines by logging activities in a database, such as work tasks, leisure activities, and exercise, and generating a bar graph that displays the time spent on each category. This insight allows them to make informed adjustments to their schedules, prioritize tasks more effectively, and achieve a better work-life balance.
Create a Form for Free Today with our Notion Forms Builder
NoteForms's Notion forms builder supercharges Notion by enabling seamless form creation that integrates directly with Notion databases. Our key features include creating forms from existing Notion DBs, storing submissions in Notion DBs, unlimited forms and submissions, full customization (custom domains, design, logic, webhooks), embeddable forms, integrations (email, Zapier, Slack), support for Notion-specific columns (relation, people), writing to page body, and database views as a sub-product.
We cater to Notion power users, SaaS startups, and educators, solving challenges like inefficient data entry, fragmented workflows, and administrative overload. NoteForms streamlines data collection, centralizes management, and simplifies workflows, boosting productivity while cutting costs for Notion enthusiasts. Create a form for free today with our Notion forms builder!
Practical Tips and Best Practices for Effective Graph Usage

Boost the Readability and Clarity of Your Notion Graphs
Graphs are visual representations of data, so their ultimate goal is to help you and your audience quickly understand a story about that data. To this end, here are some tips for improving the readability and clarity of your graphs in Notion.
Use Legible Fonts and Colors
When designing your graphs, choose fonts that are easily read at a glance. Avoid overly decorative fonts that may distract from the data. Additionally, select color palettes that are visually appealing but distinct enough to differentiate between various data points. For instance, contrasting colors for different categories in a bar graph can help viewers quickly identify trends.
Clear Labels and Titles
Ensure all axes are clearly labeled with descriptive titles that indicate the data's representation. For example, if you are displaying sales over time, label the X-axis as "Months" and the Y-axis as "Sales ($)." This clarity helps viewers understand the context of the data without needing additional explanation.
Incorporate White Space
Utilize white space effectively to prevent overcrowding in your graphs. Too much information crammed into a small area can overwhelm viewers and obscure key insights. By strategically placing white space around elements of the graph, you can guide the viewer's eye to the most critical aspects of the data.
Avoid Clutter
Limit the number of data points or categories displayed in a single graph to avoid confusion. If you have too many categories, consider breaking them into multiple graphs or using filters to focus on the most relevant data. This approach ensures that each graph remains focused and easy to interpret.
Collaborate with Your Team in Notion to Improve Your Graphs
Graphs are often collaborative, especially in business settings where multiple stakeholders are interested in the data and its implications. Notion’s collaborative features allow users to collaborate to create and improve graphs.
Gather Feedback from Peers
Take advantage of Notion’s collaborative features by inviting team members to review your graphs. Sharing your work allows colleagues to provide insights or suggestions to enhance the final product. For example, they might spot a trend you missed or suggest a more effective way to visualize specific data points.
Real-Time Editing
Notion’s real-time editing capabilities enable multiple users to collaborate on graph creation simultaneously. This feature is handy during brainstorming sessions or team meetings where immediate feedback is valuable. Encourage team members to contribute ideas or adjust as needed, fostering a collaborative environment.
Commenting for Context
Use Notion’s commenting feature to add context or ask specific questions about the graph directly within the document. This allows for focused discussions around particular graph elements without cluttering the visual with excessive annotations.
Version Control
Utilize Notion’s history feature to track changes made to your graphs over time. This is especially useful when collaborating with others, as it allows you to revert to previous versions if necessary or review how the graph has evolved based on team input.
Customize Your Notion Graphs for Your Needs
Notion allows users to create highly customized graphs that suit their unique preferences and needs. The various customization options improve your graphs' appearance, functionality, and usability.
Tailor Graph Appearance
Customize various graph elements, such as colors, sizes, and styles, to match your brand or personal preferences. For instance, if you’re creating a presentation for stakeholders, using your company’s color scheme can enhance brand consistency.
Adjust Chart Dimensions
Depending on where you plan to display your graph (e.g., on a dashboard vs. in a report), you may need to adjust its dimensions for optimal visibility. Notion allows you to set chart height options (small, medium, large) based on your layout needs.
Data Labels and Gridlines
Consider enabling data labels on your graphs so viewers can see exact values alongside visual representations. Additionally, gridlines can help guide the viewer’s eye across the graph; however, be mindful not to overdo it—too many gridlines can create visual clutter.
Interactive Elements
If applicable, incorporate interactive elements such as filters that allow viewers to customize what data they see based on specific criteria (e.g., date ranges or categories). This interactivity enhances user engagement and allows for deeper exploration of the data.
Use Notion Graphs to Track Progress and Analyze Trends
Graphs are useful for visualizing data at a single point in time. However, they truly shine when tracking progress over time and analyzing trends. Here’s how you can efficiently use Notion graphs to accomplish both tasks.
Use Graphs for Regular Updates
Regularly update your graphs with new data points to track progress over time. For example, if you’re monitoring project completion rates weekly, ensure your graph reflects this by periodically updating it with new task statuses.
Analyze Trends Over Time
Create line graphs designed for trend analysis over extended periods (e.g., quarterly sales growth). By visualizing trends clearly, you can identify patterns that inform future strategies or highlight areas needing attention.
Set Benchmarks for Comparison
Incorporate benchmark lines in your graphs (e.g., average sales figures) so viewers can easily compare current performance against historical standards or goals. This contextual information adds depth to your analysis and supports informed decision-making.
Highlight Key Insights
Use annotations or callouts within your graphs to draw attention to significant insights or anomalies in the data (e.g., spikes in sales during a promotional period). This practice helps guide discussions around critical findings during meetings or presentations.
How NoteForms Enhances Data Visualization in Notion
Smooth Integration with Notion Databases
One of NoteForms's standout features is its ability to integrate directly with Notion databases. Users can create forms corresponding to the fields in their Notion tables, meaning any data collected through these forms is automatically formatted and stored correctly in the database. This eliminates the need for manual data entry, reducing errors and saving time.
Field Type Compatibility
NoteForms supports all field types available in Notion, including text, numbers, select options, dates, checkboxes, and more. This flexibility allows users to design forms that capture a wide range of information tailored to their needs.
People and Relation Fields
The integration also includes support for relation and person fields. Users can create questions in their forms that populate related records in Notion or allow respondents to select users from the same workspace. Such capabilities are essential for maintaining organized and interconnected data sets.
Customizable Forms for Enhanced User Experience
NoteForms provides extensive customization options, enabling users to create visually appealing forms that align with their brand identity. Customization features include:
Styling Options
Users can customize colors, fonts, and themes to match their branding. This enhances the form's aesthetic appeal and user engagement by making it more inviting.
Conditional Logic
The platform allows for more innovative forms through conditional logic, meaning specific questions can be shown or hidden based on previous responses. This feature streamlines the data collection by ensuring respondents only see relevant questions.
Ready-Made Templates
NoteForms offers a variety of ready-made templates for everyday use cases, such as feedback forms, surveys, and project updates. These templates can be quickly modified to fit specific requirements, allowing users to get started without extensive design skills.
Efficient Data Collection and Storage
The primary advantage of NoteForms is its ability to automate data collection efficiently. When respondents submit a form:
Automatic Data Entry
Submissions are instantly sent to the designated Notion database without manual intervention. This real-time data entry ensures that teams have immediate access to new information as it comes in.
Notifications
Users can set up notifications through email or integrations with platforms like Slack or Discord whenever a form submission occurs. This feature keeps teams informed about new entries without constantly checking the database.
File Uploads
For businesses requiring document submissions (e.g., resumes or project files), NoteForms supports secure file uploads directly through forms. This capability allows users to collect essential files alongside other data points seamlessly.
Enhanced Data Visualization Capabilities
Once data is collected via NoteForms and stored in Notion databases, it can be easily visualized using Notion’s graphing tools:
Creating Graphs from Collected Data
With the submissions organized in a structured format within Notion, users can create various graphs (bar charts, line graphs, pie charts) based on this data. For example, customer feedback collected through surveys can be visualized in a bar chart showing satisfaction levels across different categories.
Trend Analysis
Users can track trends over time by regularly updating the database with new submissions from NoteForms. For instance, if a business collects monthly feedback on service quality, it can visualize changes in customer satisfaction over several months using line graphs.
Data Filtering and Sorting
Notion allows users to filter and sort their databases quickly. Combined with graphs, this functionality enables teams to focus on specific data segments, such as feedback from particular demographics, enhancing analysis and decision-making processes.
Practical Applications Across Industries
The integration of NoteForms with Notion databases has practical applications across various industries:
Customer Feedback Collection
Businesses can gather customer insights through surveys designed in NoteForms. The resulting data is automatically stored in Notion for analysis using graphs.
Employee Surveys
HR departments can use NoteForms to conduct employee satisfaction surveys and visualize results over time to identify trends that require attention.
Project Updates
Teams can collect regular updates on project status through custom forms; this information can be visualized to monitor progress against deadlines.
Event Registrations
Organizations hosting events can utilize NoteForms for registration processes while automatically organizing participant information within Notion.
Academic Research
Educators and researchers can collect survey responses or study results through NoteForms and visualize findings within their Notion workspace for presentations or reports.
Create a Form for Free Today with our Notion Forms Builder
NoteForms's Notion forms builder supercharges Notion by enabling seamless form creation that integrates directly with Notion databases. Our key features include creating forms from existing Notion DBs, storing submissions in Notion DBs, unlimited forms and submissions, full customization (custom domains, design, logic, webhooks), embeddable forms, integrations (email, Zapier, Slack), support for Notion-specific columns (relation, people), writing to page body, and database views as a sub-product.
We cater to Notion power users, SaaS startups, and educators, solving challenges like inefficient data entry, fragmented workflows, and administrative overload. NoteForms streamlines data collection, centralizes management, and simplifies workflows, boosting productivity while cutting costs for Notion enthusiasts. Create a form for free today with our Notion forms builder!
Common Pitfalls When Using Notion for Graphs and How to Overcome Them

Data Formatting Disasters: What They Are and How to Avoid Them
When exporting or integrating data from other platforms like Google Sheets, Airtable, or CSV files, the data might need to be formatted correctly for graph creation in Notion. For example, date formats, numeric values, or text fields may not align properly with Notion’s database structure, leading to errors when creating graphs.
Different platforms often use various data structures and formats (e.g., date formats can vary across countries and tools). The notion may struggle to automatically recognize these formats, resulting in inconsistencies or incorrect visualizations.
Solution
Pre-check Data Formatting Before Import
Always review your data for consistent formatting before importing it into Notion. For instance, ensure all dates are in the same format (e.g., YYYY-MM-DD) and numerical values don’t contain special characters like commas.
Clean Up Data Using Google Sheets or Excel
Use spreadsheet tools like Google Sheets or Excel to clean up and standardize your data before importing it into Notion. These tools offer functions that make it easy to format dates, numbers, and text fields consistently.
Leverage CSV Formatting Tools
If you export data to CSV, ensure the structure aligns with Notion’s expected format. Use tools like OpenRefine to clean up and format your CSV files before importing them into Notion.
Notion Graphs and Real-Time Data: No Match Made in Heaven
Notion does not natively support real-time updates for graphs, meaning that if your data changes frequently (e.g., sales numbers, website traffic), your graphs may need to be updated quickly. This can lead to decisions being made based on outdated information.
Notion lacks native support for live data feeds, which means external data sources like Google Sheets or Airtable won’t automatically update in real time within Notion.
Solution
Use Third-Party Integration Tools
To keep your data live, integrate Zapier or Integromat to automate real-time syncs between external data sources and Notion. These tools allow you to create workflows that automatically pull updated data into Notion regularly.
Manual Refresh for Time-Sensitive Data
Consider creating a workflow that allows you to trigger a data refresh for highly dynamic data manually. Set reminders for regular updates and manually refresh graphs or reimport data when necessary.
Embed Live Google Sheets or Airtable Views
Instead of exporting static data, consider directly embedding live Google Sheets or Airtable views into Notion. This ensures that the data displayed in the embedded graph is always up to date.
The Limited Native Graphing Options in Notion
The notion does not have built-in support for advanced graph types (e.g., pie charts, scatter plots, or Gantt charts). Users are often limited to viewing databases in table or list formats without more complex visualizations.
Notion is primarily a database and project management tool and does not natively offer extensive graphing or charting functionalities like dedicated data visualization tools.
Solution
Use Integrations for More Complex Graphs
Leverage integrations with tools like Google Sheets, Airtable, or Power BI to create more complex graphs and charts. Once created, these graphs can be embedded back into Notion for easy access and reference.
Embed External Graphing Tools
Create and customize advanced graphs using third-party tools like ChartBlocks, Vega-Lite, or Tableau. Once your graphs are finalized, embed them into Notion pages using Notion’s embed feature.
Export Data to External Tools
If you prefer not to embed graphs, export your Notion database to a CSV file and import it into Excel or Google Sheets to build your graphs. This gives you access to more advanced graphing options.
Performance Issues with Large Notion Databases
Notion databases can slow down or become less responsive when handling large amounts of data, especially if you’re trying to visualize that data using graphs or charts. This makes it challenging to navigate or update the database efficiently.
Notion’s performance can degrade when handling a high volume of data points, as it’s not optimized for large-scale data processing and visualization.
Solution
Segment Large Databases
Break your extensive database into smaller, more manageable sections. For instance, consider creating separate databases for each quarter or month instead of storing a year’s worth of data in one Notion database. This will make working with and graph smaller, more relevant datasets easier.
Archive Old Data
Archive old data that no longer needs to be visualized or referenced in graphs regularly. This will keep your working database light and responsive while maintaining access to historical data if needed.
Use Filters for Graphing
Apply filters within your Notion databases to limit the data shown in your graphs. For example, instead of visualizing all data points, filter your data by date range (e.g., showing only the last quarter) to ensure smoother performance.
Data Privacy and Security Risks with Notion Graphs
When exporting sensitive data from Notion to external platforms for graph creation, there may be concerns about data privacy and security, especially if you’re working with confidential or sensitive information.
External integrations or third-party tools may not always provide the same data protection as Notion’s native infrastructure. Sensitive data can be exposed to security vulnerabilities during the transfer or export.
Solution
Ensure Encryption and Data Privacy Policies Are Followed
When using third-party tools for data visualization, ensure that they comply with industry-standard encryption and privacy regulations (e.g., GDPR). Always check their data handling policies before sharing sensitive information.
Use Permission-Based Sharing
Use permission-based sharing to limit access to data. For instance, when embedding Google Sheets or Airtable graphs in Notion, ensure that the sharing settings are appropriately configured to restrict who can view or edit the data.
Anonymize Sensitive Data
If you must export sensitive data, consider anonymizing or redacting identifying details before transferring the data to external platforms for graph creation. This ensures that no sensitive information is shared externally.
Create a Form for Free Today with our Notion Forms Builder

NoteForms's Notion forms builder supercharges Notion by enabling seamless form creation that integrates directly with Notion databases. Our key features include creating forms from existing Notion DBs, storing submissions in Notion DBs, unlimited forms and submissions, full customization (custom domains, design, logic, webhooks), embeddable forms, integrations (email, Zapier, Slack), support for Notion-specific columns (relation, people), writing to page body, and database views as a sub-product.
We cater to Notion power users, SaaS startups, and educators, solving challenges like inefficient data entry, fragmented workflows, and administrative overload. NoteForms streamlines data collection, centralizes management, and simplifies workflows, boosting productivity while cutting costs for Notion enthusiasts. Create a form for free today with our Notion forms builder!
Related Reading
Written by


.jpg?table=block&id=77f25ade-b9b1-4070-b6eb-5bc0e932443b&cache=v2)
.jpg?table=block&id=fa5c2211-93d6-4757-8044-40c3049ab1b9&cache=v2)


.jpg?table=block&id=15a898ba-66b4-467a-a922-0bef9e70c2a4&cache=v2)

.jpg?table=block&id=a618bee7-5455-4c1f-bc91-e9d9b0448a06&cache=v2)

.jpg?table=block&id=d9c090b7-7324-4a37-8113-d4f0141b58c2&cache=v2)

.jpg?table=block&id=49f6a23a-d9b3-4bd4-8803-84575428a848&cache=v2)


.jpg?table=block&id=1b229359-9e9a-411f-b804-5796a497ed26&cache=v2)

.jpg?table=block&id=38cbd38e-bd1d-46f2-bd0c-1da51de40470&cache=v2)

